Live Updates
The mitigation of severe environmental events and natural hazards is of increasing importance. Mathematical modelling and analysis has the potential to help address challenges identified in this area.
Five industrial challenges were posed by three organisations: the Environment Agency, JBA Trust and Sweco. These challenges involved both broad and specific issues relating to the application of models to predict and analyse environmental events. Over the study group days, 55 mathematicians and environmental scientists worked to develop solutions (or partial solutions) to these challenges and regular updates were posted as the challenges were presented and the solutions were worked on.
Since the event, reports have been prepared, peer reviewed amd revised and these can be seen on the main event webpage.
Monday 3rd April 2017
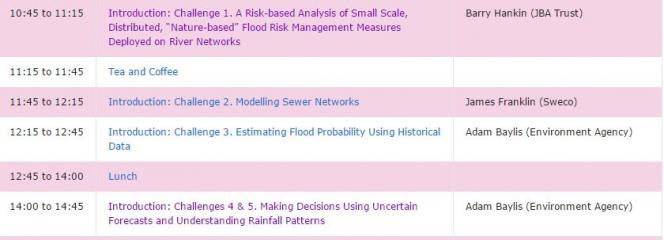
Each of the challenges from industry was presented and then delegates self selected which challenge to work on over the 4 day workshop.
Tuesday 4th April 2017
Having selected which challenge to work on, delegates spent Tuesday working on potential solutions.
Click here to download more information on the challenges - with a non technical description of each challenge.
A Risk-based Analysis of Small Scale, Distributed, “Nature-based” Flood Risk Management Measures Deployed on River Networks (JBA Trust)
This Challenge seeks to understand the performance and optimisation of a system comprising a collection of individual RAFs (Runoff Attenuation Features) distributed spatially throughout a connected stream network in a river catchment.

Modelling Sewer Networks (Sweco)
Water companies maintain large 1D sewer network models. These 1D networks are utilised by councils to discharge their statutory responsibilities with regard to flooding, usually to an engineering consultancy. The 1D models are generally composed of manholes and conduits that represent the conveyance part of the network; the collection network (gullies and so on) is not typically represented.

Estimating Flood Probability Using Historical Data (Environment Agency)
Understanding the chance that a property will flood is fundamental for deciding which projects get funded. Usually we use flood models to estimate flood probabilities. But models are expensive to build, making some small projects prohibitively expensive. Could we use statistics instead, to get an answer that is good enough?

Making Decisions Using Uncertain Forecasts (Environment Agency)
Probabilistic forecasting has become a standard part of our flood warning system over the last ten years. The new challenge is in turning mid to low certainty forecasts into action.

Understanding Rainfall Patterns (Environment Agency)
Most rainfall dependent flood models are built with the assumption of a single design event. Essentially this means that the same rain falls everywhere at the same time. We know that’s not how rain falls in real life and so we could be leading to over or underestimates of flood risk in some areas.

On Tuesday night, delegates carried on working on potential solutions to the industry challenges and gave presentations on their progress.
Wednesday 5th April 2017
Delegates worked on the potential solutions and prepared their final presentations.


The Wetropolis Flood Demonstrator arrived from the University of Leeds and created a lot of interest.

Update on the Challenges
Challenge 1: A Risk-based Analysis of Small-Scale, Distributed, “Nature-based” Flood Risk Management Measures Deployed on River Networks (JBA Trust)
The group is attempting to assess the performance of and optimise a system of individual ‘leaky dam’-type features, known as runoff attenuation features (RAFs), within a stream network analysis. The challenge boils down to how to represent arbitrary collections of (say, n) RAFs in the network. To guide the investigation, the group has posed three questions:
(1) how to model flow in a river basin using network theory?
(2) how to model its interaction with RAFs?
(3) how effective are they, and what happens if they fail?
The network of streams and RAFs is represented by a collection of vertices and edges. Somewhat contrary to intuition, the edges denote the RAFs and the nodes are the water channels between different RAFs. The problem is framed in this way since the interesting maths and physical constraints of the problem occur along the edges (i.e., at the RAFs). The network should be characterised by realistic data such as variable stream slopes, flood wave speeds, friction and inflow boundaries, provided by the JBA Trust. A system of ordinary differential equations has been derived for the water depth in the network, which is modulated by the presence of RAFs. This approach allows water to build up behind the ‘dams’ when the flow is high. Solving the system yields time-dependent water depths, and from there an optimisation problem arises. The goal is to minimise the flooding (i.e. water depth exceeding a critical height) at a downstream location given a system of n RAFs located around the network. This can be achieved by changing the location of RAFs around the network to avoid floods in a given location. To tackle the third question, each RAF can be assigned a fragility curve that prescribes probabilities to its chance of failure. The consequences of such failures can then be assessed for the global network of streams and RAFs.
Challenge 2: Modelling Sewer Networks (Sweco)
The urban flood model ‘InfoWorks’ used by Sweco comprises a subsurface sewer network and a street-level road surface model. The two are coupled via manholes but smaller drains/gullies are not included. As a consequence, the model does not represent floodwater drainage correctly. In a typical simulation, floodwater stays on the road surface and doesn’t drain away as it should due to these drainage representation issues. The crux of this challenge is how to represent the gullies (i.e., drains) in the model without including them directly (due to limits on computational cost).
The group is using a model based on the St. Venant equations for area-averaged shallow water flow. The 2D surface model consists of an idealised road representation including pavements, drains, and manholes. The sewer network comprises 1D channels with manhole inlets. These surface and sewer components have been implemented and the task is to specify a novel coupling that incorporates the effect of drains in the sewer network. The proposal is to parameterise the drains by specifying a simple line source term (e.g averaged over a few drains) for input in to the sewer network. Once implemented, numerous test case simulations can be conducted in which the road geometry and distribution of manholes and drains is varied.
Challenge 3: Estimating Risk Bands using Historical Flood Data (Environment Agency)
This group is tasked with developing a tool that takes data on the frequency of historic flood events at a given location and automatically places properties in that location in flood risk bands. The properties should fall into four risk bands proposed by the EA: very significant, significant, moderate or low chance of flooding.
The type of historical data is fairly basic: a list of dates of flooding events, e.g for an annual record, 2016 – yes, 2015 – no, 2014 – no, and so on. This binary data is rather crude, but its simplicity means that it is straightforward to keep/obtain records. The group has taken a Bayesian approach to develop ‘Binomial flood probability’ model that was demonstrated live in the presentation. As an input, the model takes the number of floods x in n years and allocates bands given trained prior distributions and likelihoods.
Challenge 4: Making Decisions with Probabilistic Forecasts (Environment Agency)
Turning probabilistic forecasts into a confident decision is a non-trivial problem with potentially high stakes. This group seeks to evaluate the (mis)use of probabilistic flood forecasts in incident response and proactive flood management, and in doing so, develop a ‘Decision Support System’ to aid practitioners.
The group is using synthetic data, comprising different ‘pay-offs’ or ‘damages’ for making certain decisions, to assess how different decisions stemming from the same probabilistic forecast are made. The goal is to define a decision criterion for the optimum course of action given the uncertainty of projections and level of risk associated with the event. Python and Excel versions of a ‘decision support toolkit’ are being developed, which includes look-up tables based on historical events to assist in rapid decision-making. Currently, the toolkit is being tested with real data from the EA on river levels and potential damages in Colne, Essex. The group also plans to ascertain the value of waiting before making decisions. Such ‘branching’ decisions are a key part of flood management and can potentially save critical resources and time. On the other hand, waiting too long before making a decision can affect both the cost and damage dramatically.
Challenge 5: Spatial Rainfall Distribution in Flood Modelling (Environment Agency)
This group is developing a method to improve the spatial distribution of rainfall in flood models. The aim is to achieve a marked improvement with only a minimal increase in the modelling resource and time. Providing a full picture of the rainfall distribution across a large river catchment is prohibitively expensive in terms of both resources and time. It is hoped that something tractable can be achieved by using pattern recognition to reduce the dimensionality and by sampling spatially variant extreme rainfall distributions using novel Monte Carlo techniques.
To aid their study, the group is using ‘Wetropolis’, a tabletop flood-demonstrator that conceptualises the science of flooding and rainfall in an idealised river catchment. Physically, it comprises a river channel with parallel canal, a reservoir for water storage, a porous flow cell (analogous to a moor) with observable groundwater flow, and random “rainfall”, which may or may not lead to flooding in the idealised urban area of Wetropolis. A numerical model of Wetropolis exists from which rainfall intensity can be sampled. The goal is to define an impact metric (based on a weighted rainfall intensity) and a damage function relating to flood extent (i.e depth of water in the model) and then formulating a minimisation problem.
Thursday 6th April 2017
Final discussion took place and then the potential solutions to the 5 challenges were presented. Copies of the presentations and recordings of the talks are on the Programme page.
Summary of the Challenge Solutions Discussions
Challenge 1: A Risk-based Analysis of Small-Scale, Distributed, “Nature-based” Flood Risk Management Measures Deployed on River Networks (JBA Trust)
The group presented details of the network model in detail. The model simulates the global behaviour of an arbitrary collection of RAFs (or dams) in a stream network. The model comprises a system of 1D conservation laws for the cross-sectional area A of the flow around the network, and evolves according to prescribed channel fluxes in each segment and rainfall in-flow. The form of A is modulated by the presence of dams and is a function of water depth h, channel width w, and slope s of the channel. The prescribed fluxes obey Manning’s law before water reaches a dam and a Bernoulli-type law when in contact with a dam, including expressions for leakage, permeability, and overflow. For a more realistic overflow, the model assumes a trapezoidal generalisation for the channel geometry.
Initial numerical examples investigated the dynamics of water depth and discharge for each segment with and without dams and showed encouraging results: the presence of dams in the system can be shown to delay and reduce the flood peak downstream. The JBA Trust is particularly interested in examining the effect of dam failures (e.g.due to erosion or overloading) on the network. To tackle this, the group considered how to model potential dam failure. This can be achieved using fragility curves, which prescribe a probability that a dam will collapse as a function of water level and age. These fragilities are prescribed to each dam in the network: when the water height reaches a critical height, dams may collapse and can no longer control the flow. Numerical simulations with these in-built failure mechanisms produced interesting and unforeseen results on the order of dam collapse within a network. Finally, an optimisation problem has been formulated that minimises a cost function associated with building the dams, subject to the constraint that the water height in the final segment is below the critical flooding height. This presents lots of scope for investigating potential mechanisms for failure and for optimising dam design.
Barry Hankin from JBA Consulting thanked the group for their hard work and promising results. There are few studies that incorporate potential failure of dams in a river network - the work arising from this study group will stimulate further research in this direction.

Challenge 2: Modelling Sewer Networks (Sweco)
Simulations using the numerical flood model InfoWorks exhibit artificial pooling of water on the road surface. This is an artefact of the (lack of) drainage representation in the model. A computationally tractable approach proposed by the group to tackle this issue is via ‘line’ sinks that characterise the run-off from the 2D surface model to the 1D sewer network. Crucially, this method doesn’t require knowledge of the exact location of the drains, which is not available to Sweco, but parameterises the overall strength of the drainage along a street (in essence, averaging over multiple drains). The group’s initial approach attempted to directly couple a 2D surface water model based on the shallow water equations (SWEs) with a 1D sewer network at manholes and gullies via line sinks. However, coupling the 2D model to the 1D model proved harder than anticipated and time-consuming, so a revised approach was needed.
The group decided to focus their attention on two baseline 2D surface water models (to reduce the risk of total failure) with sink terms from drains and manholes included directly. To ascertain the performance of the line sink approach, the drain sinks are replaced with a line sink and compared to the baseline models. The two candidate baseline models are based on (i) the 2D SWEs with friction and (ii) a 2D diffusive wave model. This second model is an approximation to the SWEs typically used in flood models where friction dominates the inertial terms; flow is thus governed by Manning’s law, i.e a balance between pressure gradient terms and friction terms. Both models use a hydrological source term for rainfall. Numerical simulations have been carried out in a street geometry comprising a cambered road with manholes in the middle and drains at the edges. Initial results show that the inclusion of drain sinks (and subsequently a line sink) provides three times more drainage than with manholes only and therefore shows potential in eliminating the artificial pooling of floodwater. Moreover, simulations with the diffusive wave model show that the line sink parameterisation can provide similar results to the direct drain representation; this demonstrates further the potential for the line sink approach in improving the full collection network in the flood model.
Since the Study Group, Sanita Vetra-Carvalho has written an article with more information about the challenge and her experience of being part of the study group.

Challenge 3: Estimating Risk Bands using Historical Flood Data (Environment Agency)
The group reiterated the limitations of using binary data (flood or no flood) rather than hydrologic data such as river flow time series. Given these data constraints, it is impossible to develop a physically-based model that requires no human judgement or input. However, it is feasible to create a transparent tool for modelling the probability of a flood occurring at a given location if there exists sufficient historical data at this location. If successful, this can serve as a ‘proof-of-concept’ for the Environment Agency.
As demonstrated earlier in the week, one potential solution is to adopt a Bayesian approach to develop a ‘Binomial flood probability’ model that takes the number of floods x in n years to produce an output. Ideally, the model should also make use of all prior knowledge of the risk of at least one flood occurring at any given year, and this knowledge needs to be quantified and expressed probabilistically. This can come from local communities, the Environment Agency and scientific studies, and requires defining and tuning for each location. The Bayesian framework explicitly accounts for this knowledge via the prior distribution and yields an exact posterior distribution (i.e. probability of a flood occurring given the data). An Excel spreadsheet tool has been developed that allows one to investigate different combinations of n and x for a range of prior distributions from the Beta family. The output is clearly dependent on the prior, but specifying a suitable prior is not a trivial task. However, the model still functions adequately and produces interesting results when a flat (i.e., non-informative) prior is specified. Ideas for further work include (i) looking at different distributions of records (e.g., skewed, multi-peaked, clustering, false/missing records etc.), and (ii) taking into account climate change.
Adam Baylis from the Environment Agency commented that the group’s work formed a positive feasibility study that encourages further consideration of simple probabilistic tools in flood management.

Challenge 4: Making Decisions with Probabilistic Forecasts (Environment Agency)
Probabilistic forecasts inherently contain more information than deterministic methods, but more information does not necessarily result in better decision-making, particularly where the probabilistic forecasts contain conflicting information. To aid practitioners in the field of proactive flood management and incident response, the group is developing an easy-to-use decision-making tool for multiple forecast, multiple action, and delayed decisions. An example of the type of data that the group is working with comes from the Colne Barrier in Essex, and comprises an ensemble of river level forecasts, damage potential, and cost of action (i.e.closing the flood barrier) at a given location. The ensemble forecasts predict a range of river levels with different damage potentials and costs over time. The Environment Agency costing method incorporates the effect of numerous factors such as risk to life, damage to infrastructure and property, as well as the social cost of flooding. It may be the case that some forecasts suggest that it is cost-effective to close the barrier while others suggest otherwise; therein lays the crux of the problem: is it best to close the barrier now? Or wait for the next forecast?
To tackle these issues, the group adopted a ‘robust-utility’ model approach. This offers an exploratory tool that is easy to implement, accommodates a range of risk priorities, and supports both static and adaptive decision-making. The model calculates the potential pay-off of an action for a range of uncertain scenarios and scores each option, taking into account measures such as ‘threshold of acceptability’ and ‘robustness’. This information is recorded in a so-called decision matrix. The group has developed a ‘Decision Support System’ tool in Excel that takes this decision matrix along with scenario predictions and outputs scores for each scenario, highlighting the best decision given the numerous risk factors. Going forward, the group would like to test the tool on real situations.

Challenge 5: Spatial Rainfall Distribution in Flood Modelling (Environment Agency)
The group discarded the pattern recognition approach and focused fully on sampling spatially variant rare rainfall events. This approach uses Monte Carlo sampling of rainfall structure and intensity as an input for a numerical flood model, which then simulates potential flood events. The ‘Wetropolis’ idealised numerical flood model, developed by one of the group, provides a simplified testing environment to investigate potential sampling techniques. It receives rainfall in 2 locations along the river ‘catchment’ and simulates the resulting flow along a river channel. Flooding occurs when the fluid depth exceeds a critical height at a downstream location. The extent of flooding is clearly dependent on the rainfall input, which characterises the proposed challenge.
Rainfall is simulated via a Markovian transition matrix, which is spatially correlated between the two rainfall locations, and put into the Wetropolis model. The group showed some simulations that exhibit a (desired and expected) time delay between rainfall events and flooding. To quantify the impact of such events, a metric has been defined using rainfall intensity weighted by a distribution function f that characterises the spatial distribution of the rainfall. Flood damage is quantified via a damage metric that depends on exceedence of a critical flood height, and an optimisation problem is formulated that finds the optimum function f that minimises a cost function relating impact and damage. Initial results show that the optimised (non-uniform) f improves upon the baseline case of uniform rainfall, indicating that there is further scope to improve forecasts using more sophisticated spatio-temporal rainfall patterns. The simplified environment of Wetropolis offers a good ‘proof-of-concept’ for the method; a great deal can be learnt using idealised models before considering implementation in state-of-the-art flood catchment models.